1. MoonShineR: R package
Contents
1. MoonShineR: R package#
MoonShineR: R package predicts ground illuminance of moonlight in lux (lx). A prediction of twilight and sunlight illuminance is also included.
Install and load MoonShineR: R package by following instructions on https://github.com/Crampton-Lab/MoonShine.
Key features#
Provides an accurate prediction of moonlight illuminance at any geographic location and over any time period, at user-defined intervals.
Provides a prediction of twilight and sunlight illuminance as well.
Generates a
.csvtable of predicted illuminance over time.Provides a high-resolution plot of illuminance over time with simple customization.
Note
The sunlight and twilight illuminance are predicted by the sun’s altitude only, and are not intended to be highly accurate predictions of the absolute illuminance.
Tip
This website R Coder is a good resource for learning basic R functions. Start here if you are completely new to R and need instructions on how to load R, set the working directory, install packages and run code.
predict_lux()#
The first function in MoonShineR: R package is
predict_lux(), which predicts natural ground illuminance over any defined geographical location and time period in adata.frameobject.More information can be seen by entering
?MoonShineR::predict_luxin R consle. Simply start with the example provided at the bottom of the R help page, which is also shown here:moonlight_output <- predict_lux(latitude = -4.21528, longitude = -69.94056, site_elev = 0, time_zone = "EST", date_start = "2023-02-27", time_start = "18:00:00", duration_day = 14, time_interval_minutes = 5, darksky_value = 0.0008, output_directory = NULL, export_table = FALSE)
This example creates a
data.frameobject named “moonlight_output”, which is a prediction of the nighttime moonlight illuminance in Leticia, Colombia, for 14 days starting on 2023-02-27 at 6pm. The definitions of the columns within thedata.frameis provided in the R help page, which is also shown here: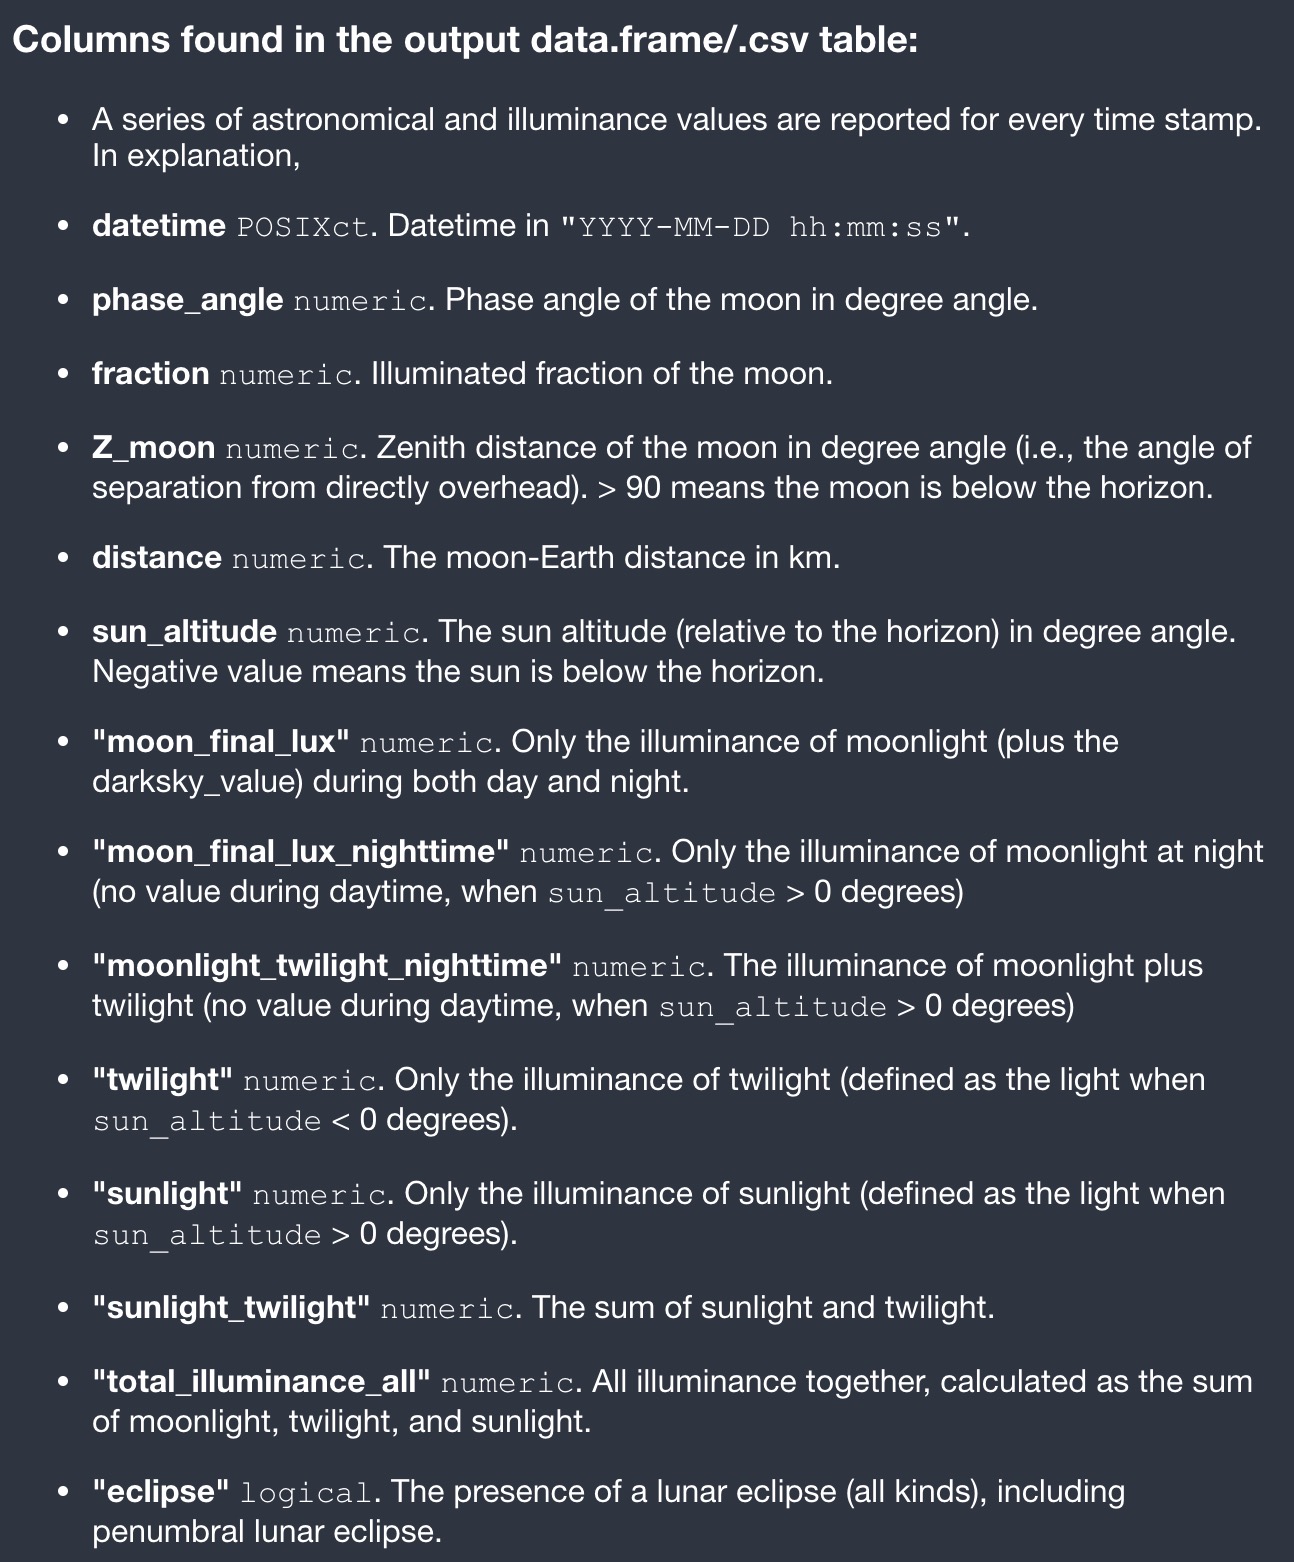
Fig. 2 Definition of the output
data.framecolumns.#The console also print a message to inform the user if there are lunar eclipse events within the simulation.
If there is no eclipse, a “no eclipse in simulation” message will appear in the R console after the simulation is complete.
If there is an eclipse, “ECLIPSE IN SIMULATION!!!” will appear in the console. MoonShineR will also report a list of all time intervals affected by both the penumbral and umbral stages of the eclipse (Fig. 3). Note that MoonShineR does not simulate the transient reduction in illuminated fraction or moonlight illuminance during a lunar eclipse (these variables will therefore be incorrectly reported reported by MoonShineR during the event).
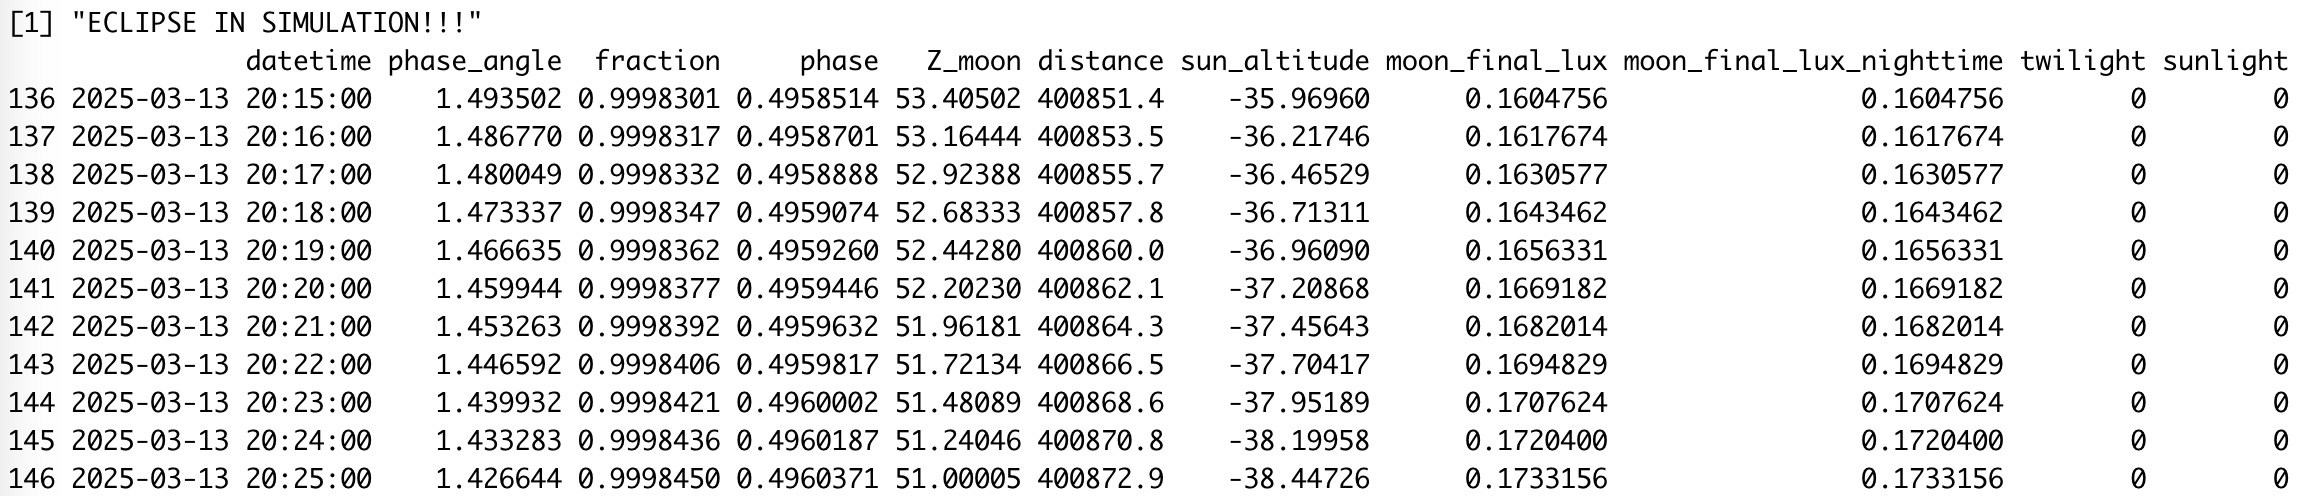
Fig. 3 Running a MoonShineR simulation during an eclipse will return a warning message and a list of the minutes of the eclipse event.#
If the above example works, you can now change the arguments to your desire. See Arguments section in the R help page for detailed descriptions.
plot_lux()#
The second function in MoonShineR: R package is
plot_lux(), which takes thedata.frameobject created bypredict_lux()to produce a clean looking plot.More information can be seen by entering
?MoonShineR::plot_luxin R consle. Simply start with the example provided at the bottom of the R help page, which is also shown here:plot_lux(df = moonlight_output, illuminance_type_plot = "total_illuminance_all", plot_y_max = 0.3, plot_dayttime_gray_mask = TRUE, plot_eclipse_red_mask = TRUE, plot_twilight = "astro", vertical_tiqme_label = TRUE, time_label_interval_hr = 24, time_labe_shift_hr = 0)
This example took the
data.frameobject named “moonlight_output” we created from the previous section and creates a plot (Fig. 4).If the above example works, you can now change the arguments to your desire. See Arguments section in the R help page for detailed descriptions.
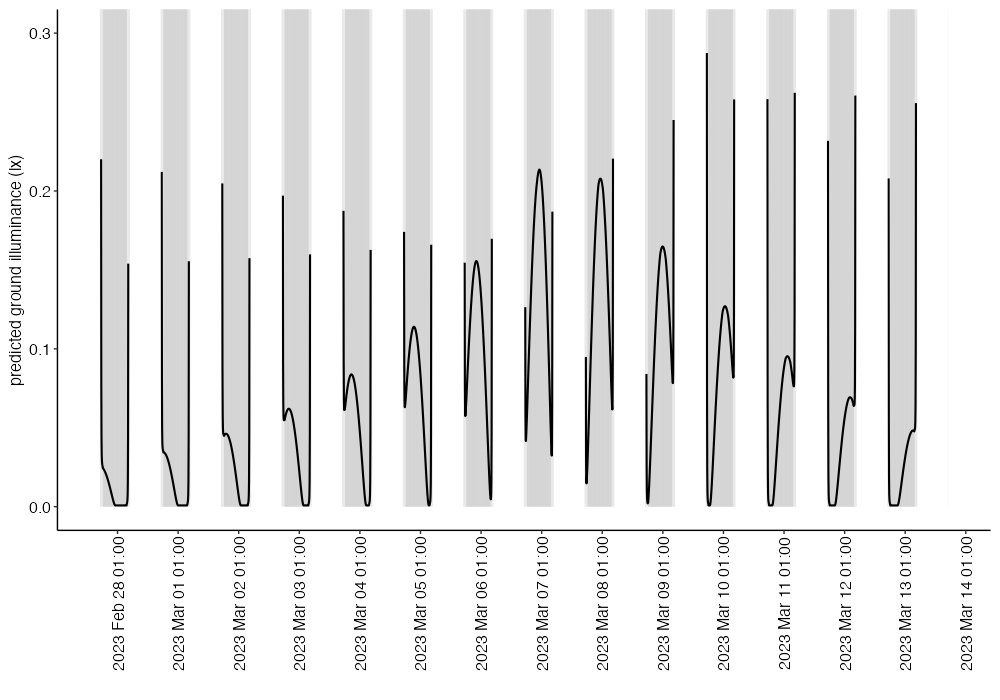
Fig. 4 Plot created in the example.#
Note
If plot_eclipse_red_mask = TRUE, and there is an eclipse during the plotted simulation period, the eclipse period will be highlighted red to warn the user that those illuminances are overestimates. This is necessary because MoonShineR does not model the illuminance reduction during an eclipse.